
Purple Martin Phenology and Migration
Jeff Kelly, Eli Bridge, and Phil Chilson
|
Our planet is experiencing one of the most ecologically turbulent periods in its history. Rapid changes in land cover and climate have affected the ecological dynamics on which numerous terrestrial and aquatic organisms depend. Phenological analyses of animal life cycles have revealed patterns of earlier spring arrival, emergence, and reproduction in the north temperate zone that are correlated with earlier onset of spring - a symptom of anthropogenically driven land use and climate change.
Remotely sensed data often have higher spatial and temporal sampling frequencies than data recorded by human observers. The use of satellite-based radar data as a measure of plant phenology is well established, and significant headway has been made in matching ground-based observations to satellite-derived data. In contrast, the use of remote sensing technology for understanding animal phenologies is in its infancy.
Watch a VIDEO of Purple Martins at a Roost site.
|
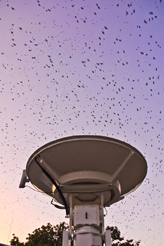 Purple Martins flying above mobile radar
One remote sensing system that routinely detects animals is weather surveillance radar (WSR). The US network of WSRs, often referred to as NEXRAD, has been used for biological investigations of animal distributions and movements almost since its inception. Nonetheless, there have been almost investigations of how phenology is impacted by land cover and climate change based on NEXRAD radar data. Due to recent convergences of several disciplines (e.g. ornithology, informatics, and meterology) and methodologies (e.g. bird tracking, spatial statistics, and weather-radar monitoring), there exists an exciting opportunity to establish radar as a valuable tool for studying the phenology of flying animals on an continental scale. We are integrating radar with an experimental approach to quantify phenology across the annual cycle of a common neotropical migrant bird, the Purple Martin (Progne subis).
We have two primary research objectives. First we are improving our capacity to interpret biological meaning of reflectivity data collected by NEXRAD, and second we are synthesizing a wide variety of data sources, ranging from continental scale environmental data to individual movement tracks, to investigate rules that govern the movements of individuals for the purpose of understanding of how individual behaviors scale up to give rise to population level phenomena – in particular the phenology of large roost aggregations detected by WSR.
|
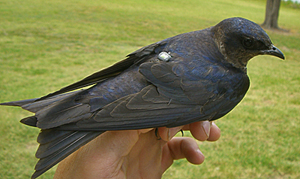 Purple Martin with a 0.6g geologger
To achieve the first goal we seek to develop a mechanistic understanding of the relationship between radar observations and the distribution and abundance of individuals in the aerosphere (lower free atmosphere). We will compare WSR data with independent observations of flying animals derived from short-range mobile radars, infrared video, observer reports, animal tracking studies, and lab-based reflectivity studies to provide a basis for quantifying WSR reflectivity data in terms of the densities and types of animals present. This effort will not only allow for ongoing monitoring of animal populations, but will aid the interpretation of 20 years of archived NEXRAD data, providing a means of assessing phenological trends in recent history.
 Our second goal is to link individual behavior to broader-scale phenology. By generating tracking data from individual birds and combining it with bird-observation data from citizen-science organizations and continental mosaic bioscatter maps based on aerial biofaunal distributions, we will generate spatiotemporal utilization distribution maps for Purple Martins. We will then integrate these maps with land use/cover, climate, and vegetative phenology maps to examine spatiotemporal correlations among environmental drivers of continental aeroecological dynamics. These maps encompass local to continental spatial scales and daily to annual temporal scales, providing an unprecedented tool to examine a wide variety of important ecological questions. We plan to make these maps and our resultant analyses publicly available so that other investigators can use this resource to address issues beyond our specific research objectives.
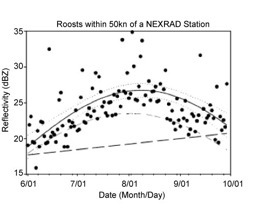
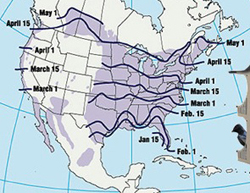
Example of phenology of bird activity at purple martin roosts as detected by weather surveillance radar (Kelly et al unpublished data). |
The results from analyses of individual movements will inform existing multi-agent movement models that can be incorporated into a radar simulator that characterizes aggregate aerial behaviors in terms of radar reflectivity. These simulations will help us to interpret empirical radar observations across multiple spatial and temporal scales as we develop analytic tools that link radar visualizations of aerial biodiversity to existing ecological theory. In this way, our two research objectives will overlap and reinforce each other. Improving radar data interpretation will provide a better understanding of how animals use the aerosphere, and improving our knowledge of animal movements will enhance our ability to use radar data to study biological phenomena. The techniques and software emerging from this effort will make radar a powerful tool for understanding and predicting how ecological dynamics scale from local to continental spatial extents.
